
Trade the structure.
Smart Money Concepts & TradingView Indicators
An interactive explainer for the structural concepts behind price — and a preview of the chart tools KATANA CAPITAL is preparing for TradingView.
Smart Money Concepts
Understand the structure behind price.
Seven core concepts on one chart. Pick a concept: the camera moves to the zone where it occurs, the marking draws in, and the explanation covers how to read it — and where it falls short.
Break of Structure. A break of structure confirms the current trend.
Chart view: two bullish breaks of structure. Price closes above the swing high at 113.00, later above the swing high at 116.40.
BOS
Break of Structure
A break of structure confirms the current trend.
In an uptrend, a candle closes above the last swing high; in a downtrend, below the last swing low. After the change of character, price closes above 113.00 and later above 116.40 — each break confirms the new bullish structure of higher highs and higher lows.
How to read it
- Confirmation comes from the candle close. A wick through the level alone is not a break.
- A BOS confirms direction. It is context, not an entry signal on its own.
Keep in mind: Breaks without follow-through are common. The next higher low shows whether the structure holds.
Educational illustration. SMC terms describe price behaviour after the fact — they are not trading signals and do not predict future prices.
TradingView Indicators
Advanced chart intelligence.
Visual tools for structured technical market analysis.
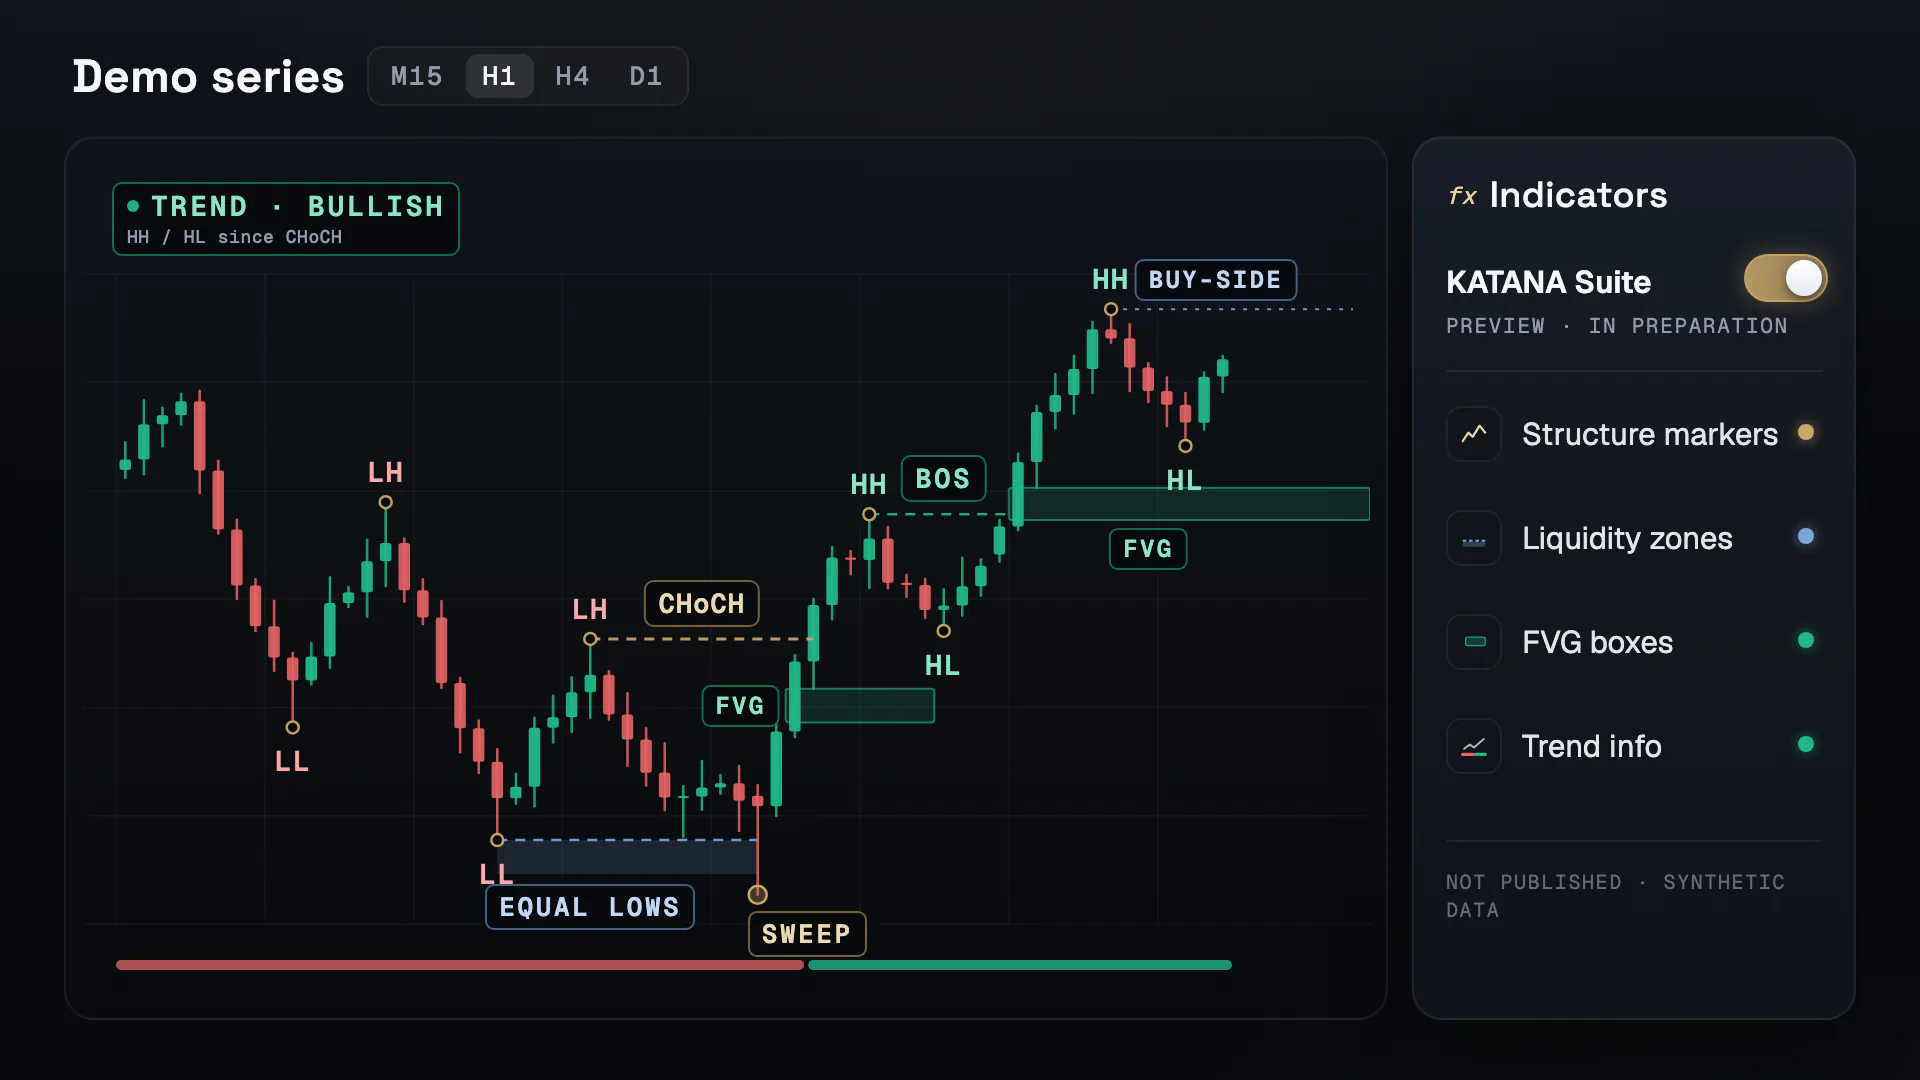
The KATANA indicator suite is in preparation. This preview shows what the planned overlays are designed to mark, how they are meant to be read and where their limits are — on synthetic data, before anything is published.
KATANA indicator suite — in preparation
No indicator has been published yet. Everything shown here is a preview on synthetic data.
Interactive demonstration
Candlestick chart with synthetic demo data. Overlays shown: Structure markers, Liquidity zones, FVG boxes, Trend information. Latest structure: bullish — higher highs and higher lows since the change of character. Open liquidity: buy-side above 124.40, sell-side below 122.20.
What the suite is designed to show
The suite is being built as a set of TradingView overlays that make market structure visible — consistently and by fixed rules. The demo shows the planned building blocks.
Structure markers
Swing highs and lows labelled HH, HL, LH and LL; breaks of structure and changes of character marked at the closing candle.
Liquidity zones
Equal highs and lows and untested swing points where stop orders tend to cluster — including the moment a level is swept.
FVG boxes
Three-candle imbalances drawn as boxes that end once price has filled them.
Trend information
The current structural bias — bullish, bearish or neutral — derived from the last confirmed break.
Planned scope
PlannedDesign principles of the suite. They describe the intended scope — not a finished product.
Rule-based markings
Every marking follows a fixed, documented definition — the same chart produces the same markings.
Confirmed by closes
Structure breaks are only marked once a candle closes beyond the level. A wick alone does not count.
Switchable layers
Structure, liquidity, imbalances and trend context as separate layers — show only what the analysis needs.
No signals, no promises
The tools visualise structure. They do not place trades and do not predict where price goes next.
Calm by design
Restrained colours and clear labels for dark charts, so that price action stays in focus.
Documented limits
Each overlay comes with an explanation of what it shows, how to read it and where it falls short.
Supported markets
Planned- XAUUSDGoldPlanned focus
- BTCUSDBitcoinPlanned focus
- +Further marketsPlanned after the first release
TradingView integration
PlannedThe suite is being written in Pine Script, TradingView’s scripting language for indicators. Once published, adding it is expected to work like adding any other TradingView script:
- Open the published script page on TradingView — the link will be listed here at publication.
- Add the script to your favourites and open a chart.
- Add it from the indicators menu and switch the layers you need on or off in its settings.
Access model and settings will be announced at publication. A TradingView account will be required.
Documentation
What each overlay means, how to read it — and where its limits are.
Structure markers
- What it shows
- Swing highs and swing lows with their structural label (HH, HL, LH, LL), plus a line from the broken swing point to the candle that closed beyond it — labelled BOS for a break in trend direction or CHoCH for the first break against it.
- How to read it
- Read the labels as a sequence. Rising highs and lows mean bullish structure; the first opposite break (CHoCH) is an early warning, further breaks in the same direction (BOS) confirm.
- Limitations
- A swing point is only confirmed after the following candles have formed, so markings appear with a delay by definition. On lower timeframes, structure changes often.
Liquidity zones
- What it shows
- Levels where stop orders are likely to rest: equal highs and lows and the latest untested swing points. When a wick trades through such a level and price closes back inside, the sweep is highlighted.
- How to read it
- Liquidity zones are reference levels, not support or resistance. A sweep followed by a strong move in the opposite direction is the classic pattern; a close and hold beyond the level is a breakout.
- Limitations
- Where orders actually rest is not visible on a chart. The zones are an estimate based on obvious levels.
FVG boxes
- What it shows
- Boxes between the wick of the first and the wick of the third candle wherever the two do not overlap. A box ends at the candle that fills the gap completely.
- How to read it
- Bullish gaps lie below the move that created them, bearish gaps above it. Note whether price reacts when it trades into a gap — and whether the gap fits the current structure.
- Limitations
- Gaps are frequent, and many are filled without any reaction. The demo shows every gap in the dataset; real charts contain many small gaps of little relevance.
Trend information
- What it shows
- The structural bias derived from the last confirmed break: bullish after a bullish BOS or CHoCH, bearish after a bearish one, neutral before the first break. Phases are shaded in the background and shown as a ribbon at the bottom.
- How to read it
- Use the bias as context for the other overlays — for example, which gaps or liquidity levels lie in the direction of the structure.
- Limitations
- The bias reacts to closed candles only and therefore lags. In sideways phases it can flip back and forth.
General limitations
Indicators describe what price has done — they do not know what it will do. Every marking depends on definitions such as swing length, timeframe and what counts as “equal”; different settings give different results. Demo charts and backtests are no evidence of future results.
Glossary
SMC glossary
Short, neutral definitions of the terms used on this page. Each term links to the matching view in the chart explorer.
- Market structure
- The sequence of swing highs and swing lows on a chart. Rising highs and lows describe an uptrend, falling highs and lows a downtrend; overlapping swings without a clear sequence describe a range.
- Show in chart: Market Structure
- Swing high / swing low
- A swing high is a candle whose high lies above the highs of the surrounding candles; a swing low is the mirror image. How many neighbouring candles are compared is a matter of definition — this explainer uses three on each side.
- Show in chart: Market Structure
- Higher high (HH) / higher low (HL)
- A swing high above the previous swing high, and a swing low above the previous swing low. Together they define bullish structure.
- Show in chart: Market Structure
- Lower high (LH) / lower low (LL)
- A swing high below the previous swing high, and a swing low below the previous swing low. Together they define bearish structure.
- Show in chart: Market Structure
- Break of Structure (BOS)
- A candle close beyond the last swing point in the direction of the trend — above the last swing high in an uptrend, below the last swing low in a downtrend. It confirms that the trend continues.
- Show in chart: Break of Structure
- Change of Character (CHoCH)
- The first close beyond a swing point against the prevailing structure, for example above the last lower high in a downtrend. An early sign that the trend may be changing — not a confirmation on its own.
- Show in chart: Change of Character
- Liquidity (buy-side / sell-side)
- Resting orders, mainly stop orders, that cluster around obvious price levels. Buy-side liquidity sits above swing highs (buy stops of short positions, buy orders of breakout traders); sell-side liquidity sits below swing lows.
- Show in chart: Liquidity Sweeps
- Equal highs / equal lows
- Two or more swing highs or lows at practically the same price. They form a clearly visible level and therefore a likely cluster of stop orders.
- Show in chart: Liquidity Sweeps
- Liquidity sweep
- A move that trades through a liquidity level — usually with a wick — and closes back on the other side. Also called a stop run or stop hunt. If price closes and holds beyond the level, it is a breakout instead.
- Show in chart: Liquidity Sweeps
- Displacement
- A strong, fast move of large-bodied candles in one direction, often leaving fair value gaps behind. In SMC, displacement is what gives structure breaks and order blocks their significance.
- Show in chart: Order Blocks
- Fair value gap (FVG)
- A three-candle pattern in which the wicks of the first and the third candle do not overlap. The gap between them — also called an imbalance — was traded in one direction only.
- Show in chart: Fair Value Gaps
- Order block (OB)
- The last opposing candle before a displacement that breaks structure: the last bearish candle before a strong move up (bullish OB) or the last bullish candle before a strong move down (bearish OB). Treated as a zone from its high to its low.
- Show in chart: Order Blocks
- Mitigation
- The return of price into a previously created zone such as an order block or a fair value gap. A gap counts as filled once price has traded through it completely.
- Show in chart: Fair Value Gaps
- Dealing range
- The price range between a significant swing low and swing high — usually the current leg of the trend. Premium, discount and equilibrium are measured within it.
- Show in chart: Premium/Discount Zones
- Equilibrium (EQ)
- The 50% level of a dealing range. It separates the premium zone from the discount zone.
- Show in chart: Premium/Discount Zones
FAQ
Frequently asked questions
Short answers about the explainer, the data and the planned indicators.
What are Smart Money Concepts?
Smart Money Concepts (SMC) are a way of reading charts through market structure, liquidity and imbalances: swing highs and lows, structure breaks, fair value gaps, order blocks and premium/discount zones. They describe price behaviour and serve as a framework for analysis — they are not a trading system.
Is the chart on this page real market data?
No. It is a synthetic, deterministic price series built for teaching, so that every concept appears clearly at a known place. It is labelled DEMO and does not represent any real instrument or period. Real charts are noisier, and the concepts rarely appear this cleanly.
Are the KATANA TradingView indicators available?
Not yet. The indicator suite is in preparation and no release date has been announced. Nothing on this page is a published indicator; names, settings and access details will be shared at publication.
Which markets will the indicators focus on?
The planned focus is gold (XAUUSD) and Bitcoin (BTCUSD), the markets KATANA CAPITAL works on. Further markets are planned only after the first release has been validated.
Will the indicators give buy or sell signals?
They are being designed as visual analysis tools that mark structure, liquidity, imbalances and trend context. They are not meant to make trading decisions — and no indicator can predict future prices.
Is this investment advice?
No. All content is general and educational. KATANA CAPITAL does not provide individual investment advice. Trading involves substantial risk, up to the total loss of the capital employed.
Questions about SMC or the indicators?
For questions or feedback on the planned tools, get in touch.