Skip to content

KATANA CAPITAL

Precision in everymarket move.

Systematic trading strategies, professional market analysis and innovative trading tools for gold and bitcoin.

  • MetaTrader 5
  • XAUUSD
  • BTCUSD
  • Rule-based

Markets in focus

XAUUSDGold

Indicative · May be delayedLoading price

BTCUSDBitcoin

Indicative · May be delayedLoading price

Systematic tradingMT5

02The KATANA Philosophy

Built on structure. Driven by discipline.

We combine technical market structure, systematic trading logic and continuous strategy development into one clearly defined trading approach.

  • 01

    Precision

    Rule-based decisions instead of spontaneous impulses.

    Potential entries are measured against defined quality criteria before an order is placed — not taken on a hunch.

  • 02

    Structure

    A focus on market structure, liquidity, momentum and volatility.

    The market phase is assessed first: trending, neutral or choppy. The approach follows what the chart shows.

  • 03

    Discipline

    Defined trading conditions, risk control and traceable evaluation.

    Risk and trade management are part of the system, and every result is evaluated in a way that others can follow.

Rules, development cycle and system modules in detail.

Learn About Our Approach

03Trading Systems

Our Trading Systems

Specialised trading strategies for different markets and market phases.

KATANA BTC DAILY

Systematic Bitcoin trading on the 15-minute chart.

Core system · continuous development
Market
Bitcoin · BTCUSD
Platform
MetaTrader 5 (Expert Advisor)
Time horizon
M15 (15-minute chart)
Style
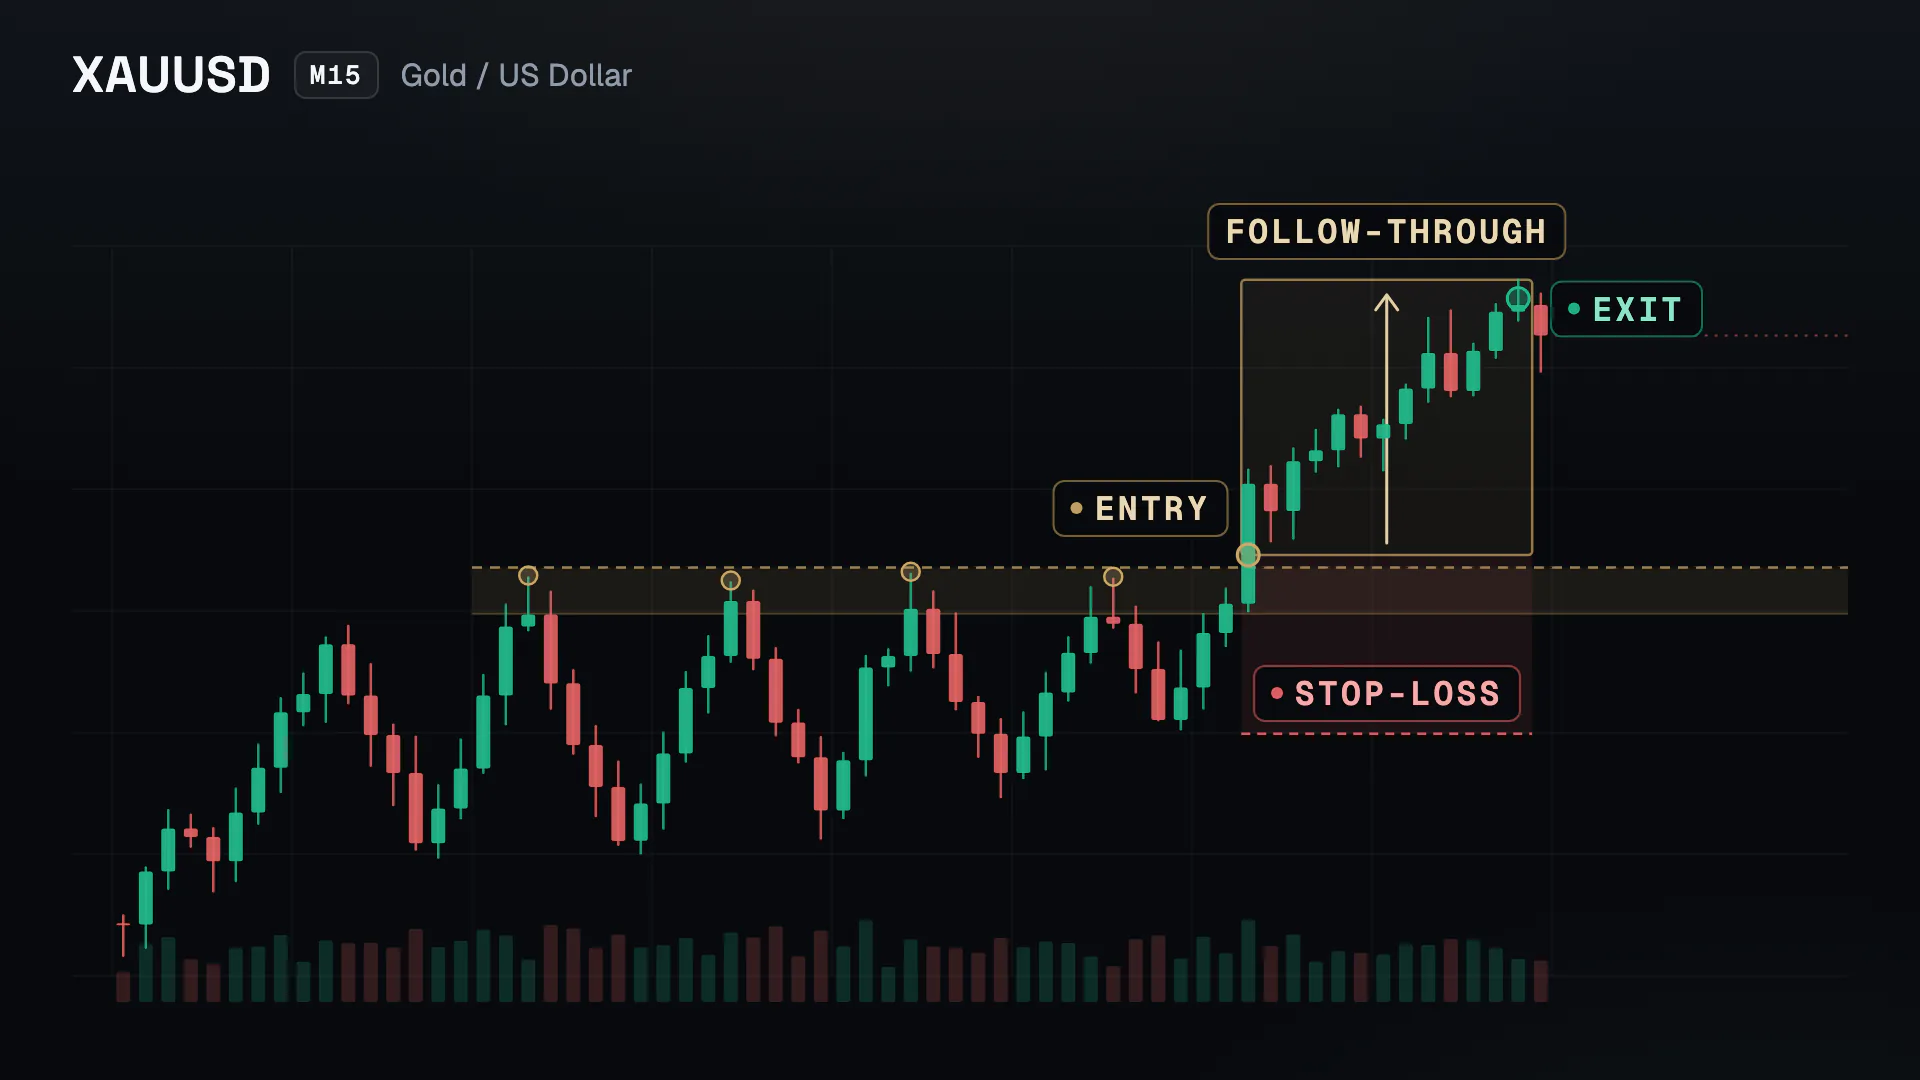
Rule-based breakout
  • Rule-based entry logic
  • Market-phase-dependent strategy
  • Risk and exit management

KATANA GOLD INTRADAY

Breakout-oriented intraday trading in gold.

Continuous development
synthetic data
Market
Gold · XAUUSD
Platform
MetaTrader 5 (Expert Advisor)
Time horizon
Intraday
Style
Breakout & momentum
  • Breakout-oriented trading logic
  • Trend and momentum analysis
  • Volatility-dependent trading conditions

KATANA XAUUSD SCALPER

Short-term scalping in gold — currently in development.

In development
Market
Gold · XAUUSD
Platform
MetaTrader 5 (Expert Advisor)
Time horizon
Short-term · M1/M5
Style
Scalping · breakout & momentum
  • Focus on short-term moves
  • M1/M5-oriented chart analysis
  • Breakout and momentum approaches

FUTURE STRATEGIES

Our research never stops.

Research · Roadmap
synthetic data

Our research never stops.

  • Research directions, not products
  • Gold: a broader daily approach
  • Bitcoin: an intraday extension
  • No timeline — validation comes first
View Research Status

Research directions only. No release dates, no availability, no results.

Compare all systems

04Smart Money Concepts

Understand the structure behind price.

Smart Money Concepts (SMC) describe how price moves through market structure and liquidity. Pick a concept — the chart moves to the relevant zone and marks it step by step.

DemoSynthetic didactic data

Break of Structure. A break of structure confirms the current trend.

DemoSynthetic didactic data

Chart view: two bullish breaks of structure. Price closes above the swing high at 113.00, later above the swing high at 116.40.

DEMO · synthetic didactic data — a constructed price series, not a real market. Each concept appears in textbook form; real charts are rarely this clean.

BOS

Break of Structure

A break of structure confirms the current trend.

In an uptrend, a candle closes above the last swing high; in a downtrend, below the last swing low. After the change of character, price closes above 113.00 and later above 116.40 — each break confirms the new bullish structure of higher highs and higher lows.

Keep in mind: Breaks without follow-through are common. The next higher low shows whether the structure holds.

Educational illustration. SMC terms describe price behaviour after the fact — they are not trading signals and do not predict future prices.

Glossary & all concepts

05TradingView Indicators

Advanced chart intelligence.

Visual tools for structured technical market analysis.

Preview

KATANA indicator suite — in preparation

No indicator has been published yet. Everything shown here is a preview on synthetic data.

Interactive demonstration

DemoSynthetic didactic data

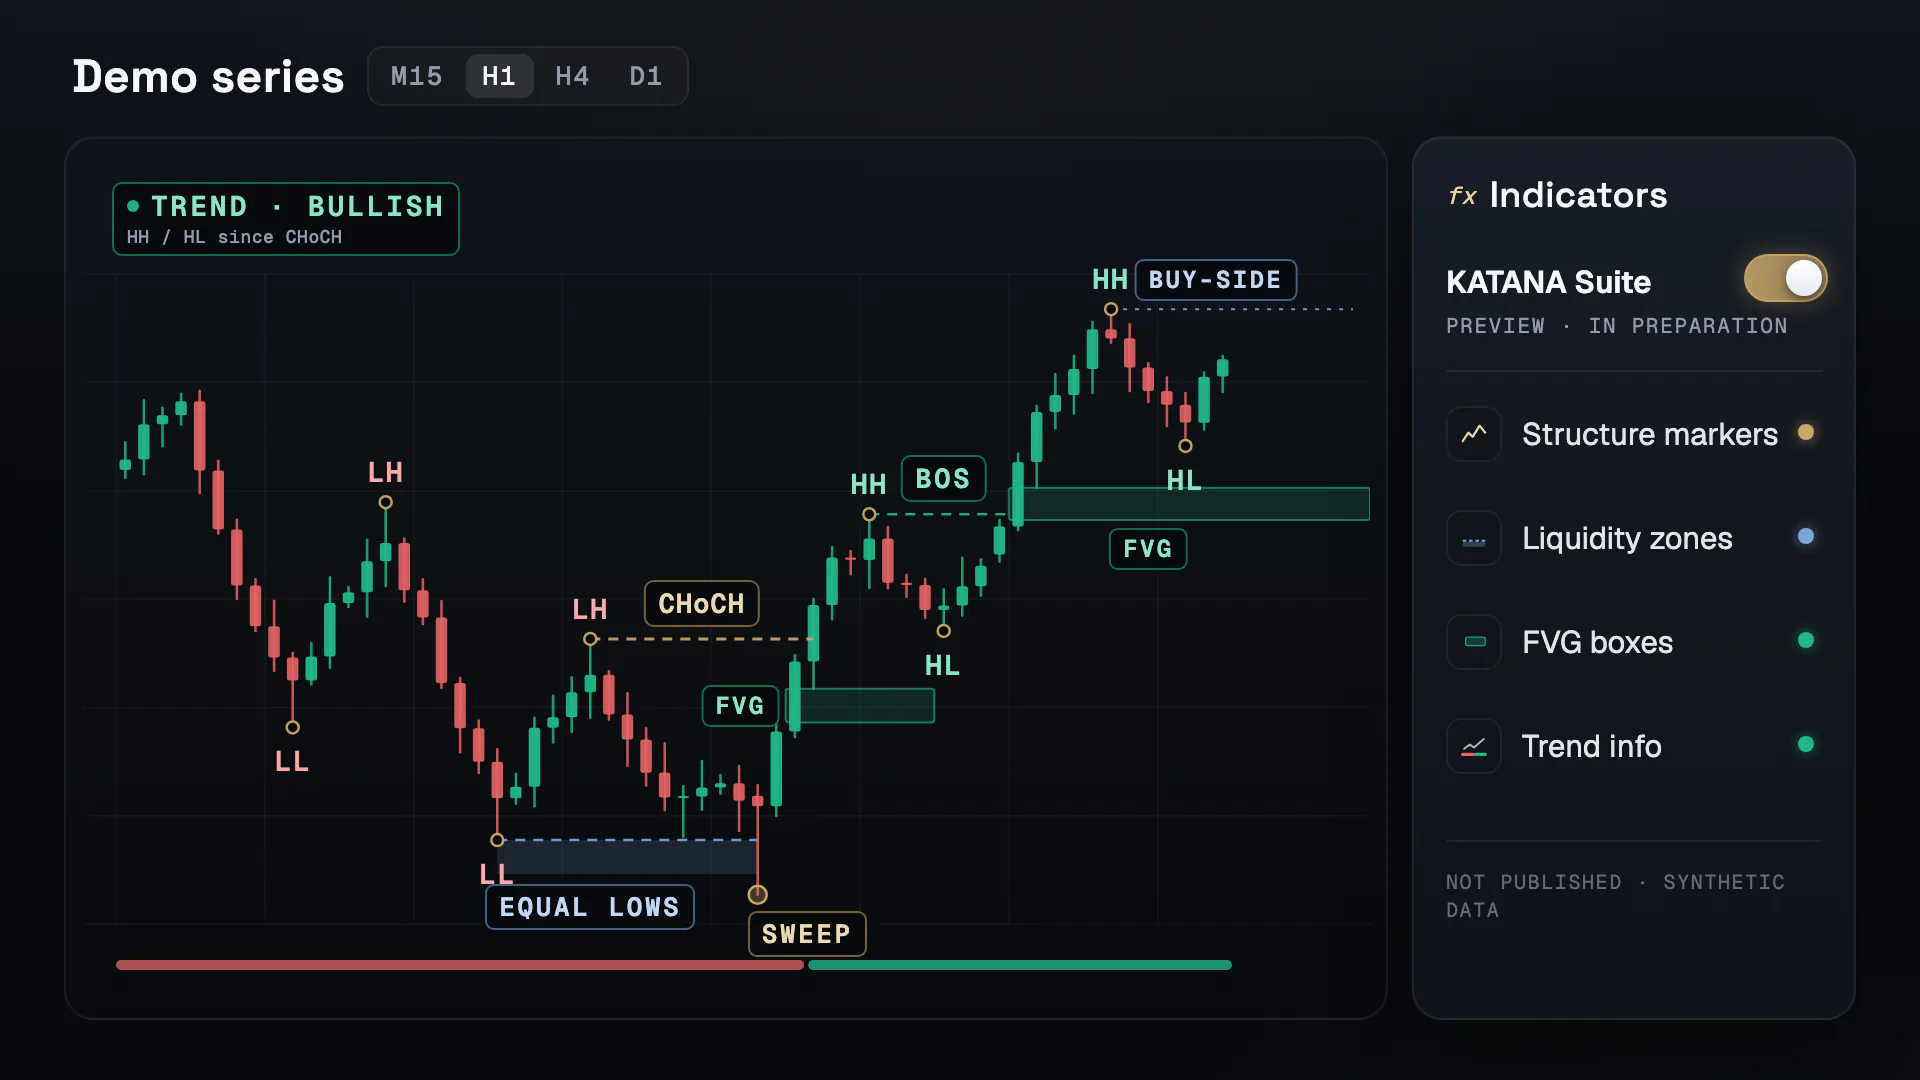
Candlestick chart with synthetic demo data. Overlays shown: Structure markers, Liquidity zones, FVG boxes, Trend information. Latest structure: bullish — higher highs and higher lows since the change of character. Open liquidity: buy-side above 124.40, sell-side below 122.20.

DEMO · synthetic didactic data — overlays computed on a constructed price series. Not a published indicator, not a real market.
Overlays

What the suite is designed to show

The suite is being built as a set of TradingView overlays that make market structure visible — consistently and by fixed rules. The demo shows the planned building blocks.

  • Structure markers

    Swing highs and lows labelled HH, HL, LH and LL; breaks of structure and changes of character marked at the closing candle.

  • Liquidity zones

    Equal highs and lows and untested swing points where stop orders tend to cluster — including the moment a level is swept.

  • FVG boxes

    Three-candle imbalances drawn as boxes that end once price has filled them.

  • Trend information

    The current structural bias — bullish, bearish or neutral — derived from the last confirmed break.

Planned scope

Planned

Design principles of the suite. They describe the intended scope — not a finished product.

  • Rule-based markings

    Every marking follows a fixed, documented definition — the same chart produces the same markings.

  • Confirmed by closes

    Structure breaks are only marked once a candle closes beyond the level. A wick alone does not count.

  • Switchable layers

    Structure, liquidity, imbalances and trend context as separate layers — show only what the analysis needs.

  • No signals, no promises

    The tools visualise structure. They do not place trades and do not predict where price goes next.

synthetic data
The overlays, animated

Supported markets

Planned
  • XAUUSDGold
    Planned focus
  • BTCUSDBitcoin
    Planned focus
  • +Further markets
    Planned after the first release

TradingView integration

Planned

The suite is being written in Pine Script, TradingView’s scripting language for indicators. Once published, adding it is expected to work like adding any other TradingView script:

  1. Open the published script page on TradingView — the link will be listed here at publication.
  2. Add the script to your favourites and open a chart.
  3. Add it from the indicators menu and switch the layers you need on or off in its settings.

Access model and settings will be announced at publication. A TradingView account will be required.

Documentation

What each overlay means, how to read it — and where its limits are.

Structure markers
What it shows
Swing highs and swing lows with their structural label (HH, HL, LH, LL), plus a line from the broken swing point to the candle that closed beyond it — labelled BOS for a break in trend direction or CHoCH for the first break against it.
How to read it
Read the labels as a sequence. Rising highs and lows mean bullish structure; the first opposite break (CHoCH) is an early warning, further breaks in the same direction (BOS) confirm.
Limitations
A swing point is only confirmed after the following candles have formed, so markings appear with a delay by definition. On lower timeframes, structure changes often.

Liquidity zones
What it shows
Levels where stop orders are likely to rest: equal highs and lows and the latest untested swing points. When a wick trades through such a level and price closes back inside, the sweep is highlighted.
How to read it
Liquidity zones are reference levels, not support or resistance. A sweep followed by a strong move in the opposite direction is the classic pattern; a close and hold beyond the level is a breakout.
Limitations
Where orders actually rest is not visible on a chart. The zones are an estimate based on obvious levels.
FVG boxes
What it shows
Boxes between the wick of the first and the wick of the third candle wherever the two do not overlap. A box ends at the candle that fills the gap completely.
How to read it
Bullish gaps lie below the move that created them, bearish gaps above it. Note whether price reacts when it trades into a gap — and whether the gap fits the current structure.
Limitations
Gaps are frequent, and many are filled without any reaction. The demo shows every gap in the dataset; real charts contain many small gaps of little relevance.
Trend information
What it shows
The structural bias derived from the last confirmed break: bullish after a bullish BOS or CHoCH, bearish after a bearish one, neutral before the first break. Phases are shaded in the background and shown as a ribbon at the bottom.
How to read it
Use the bias as context for the other overlays — for example, which gaps or liquidity levels lie in the direction of the structure.
Limitations
The bias reacts to closed candles only and therefore lags. In sideways phases it can flip back and forth.

Interested in the indicator suite?

The suite is in preparation. For questions or feedback on the planned tools, get in touch.

06Market Intelligence

The market. Decoded daily.

Daily structure analysis for gold and Bitcoin: market structure, key levels, both scenarios and the triggers that decide between them. Every analysis is dated and reviewed before publication — a technical assessment, never a trading signal.

Loading chart…
Loading chart…

Technical market assessment at the time of publication — no investment advice, no recommendation to buy or sell and no trading signal. Markets can move against any scenario at any time.

07Live Market Dashboard

Markets in motion.

Follow gold and Bitcoin in TradingView’s professional chart — with timeframe selection, zoom and symbol search. The chart is only loaded after consent.

Interactive TradingView chart · XAUUSD

Loading the chart transfers data such as your IP address to TradingView Inc. (USA). TradingView is not certified under the EU-U.S. Data Privacy Framework; data protection comparable to the EU is not guaranteed — US authorities could access the data without effective legal remedies for you.

Privacy policy

Chart & data: TradingView — may be delayed depending on exchange/source.

Symbol and interval can also be changed inside the chart.

Indicative prices

  • XAUUSD

    Gold

    Loading prices…
  • BTCUSD

    Bitcoin

    Loading prices…

Spot prices from connected sources: indicative only, may be delayed, not an executable quote. Refreshed every 60 seconds while this section is visible.

08Why KATANA

Why KATANA?

Four principles that shape how KATANA systems are designed, tested and communicated.

  • 01

    Systematic Approach

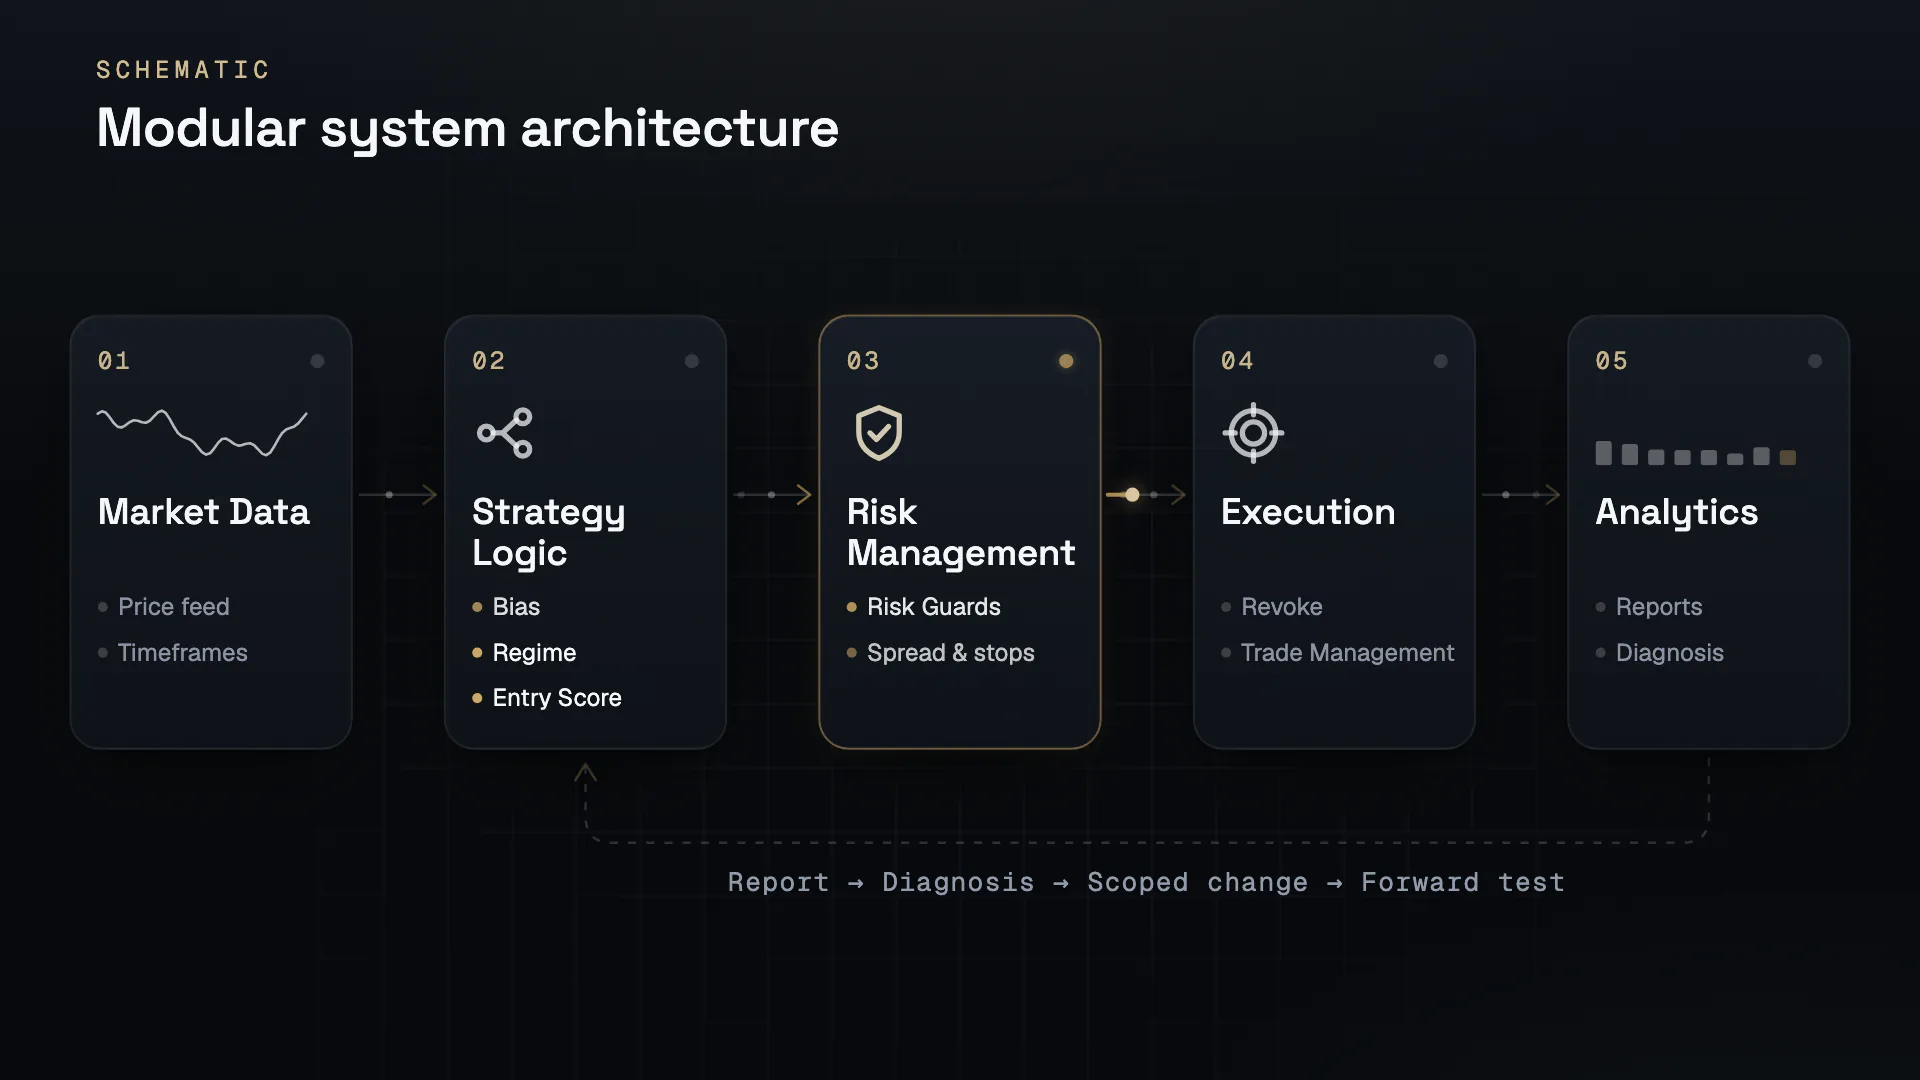
    Defined rules and traceable trading logic. Entry, risk and exit follow defined criteria, and potential entries are checked against them before an order is placed.

  • 02

    Market Specialization

    Focused development for Bitcoin and gold. Each system is built around the structure and volatility of its market — XAUUSD and BTCUSD on MetaTrader 5.

  • 03

    Continuous Development

    Ongoing analysis, testing and development. Report, diagnosis, clearly scoped change, renewed demo or forward test — a change has to fix an identifiable error, not just polish a backtest.

  • 04

    Transparency

    A clear account of strategies, development status and trading risks. Losses, drawdowns and limits are part of the picture; results are only shown with source, period, account type and system version.

The KATANA standard

No shortcuts. No promises. Just a structured approach to the markets.

09Performance & Research

Data over assumptions.

Results only count with context: source, period, account type, costs and system version. This dashboard is prepared for verified MetaTrader 5 reports — and stays empty until there is something real to show.

Loading chart…

Methodology

How to read these numbers

Numbers without context mislead. These rules apply to everything shown here.

  • Backtest ≠ live

    A backtest replays history with known data. Spreads, slippage and execution in live markets differ — results can deviate significantly.

  • Demo ≠ real money

    Demo accounts simulate fills. Real liquidity, slippage and the psychological pressure of real money are missing.

  • A short profitable phase is no proof

    A few good weeks say little about robustness. A meaningful assessment needs many trades across different market phases.

No performance promise. Past results — whether backtest, demo or live — are not a reliable indicator of future results.

10About KATANA

Engineered with purpose.

Discipline in code Clear rules. Consistent execution.

KATANA CAPITAL is a specialised project for systematic trading strategies, technical market analysis and trading software.

The work centres on development and methodology: rule-based systems for gold and Bitcoin on MetaTrader 5, continuous market observation, a conscious approach to risk, careful technological implementation and long-term product development.

Automation with traceable logic.

Focus areas

  • Development

    Rule-based Expert Advisors for MetaTrader 5, built for gold (XAUUSD) and Bitcoin (BTCUSD).

  • Methodology

    Defined entry criteria, market-phase assessment and structured trade evaluation.

  • Market observation

    Ongoing analysis of structure, liquidity, momentum and volatility in gold and Bitcoin.

  • Risk awareness

    Risk and trade management are part of every system. Losses, drawdowns and limits are named openly.

  • Technological implementation

    Clean execution logic with safeguards for risk, spread, stop distances and broker constraints.

  • Long-term product development

    Reports, diagnosis, controlled changes and forward tests instead of quick fixes.

11Contact

LET’S TALKMARKETS.

Interested in our trading systems, indicators or market analyses? Get in touch.

New message

To: KATANA CAPITAL

At least 10 characters.0 / 5,000

Required field

What we can talk about

  • Rule-based trading systems for MetaTrader 5 (Expert Advisors)
  • TradingView indicators — in preparation
  • Market analysis for gold (XAUUSD) and bitcoin (BTCUSD)

Direct e-mail

Prefer your own e-mail app? Write to us directly.

Please note
We do not provide individual investment advice and cannot assess personal investment decisions. Risk disclosure
Your data
Your details are only used to answer your message — no newsletter, no tracking. Privacy policy

Privacy settings

We only load third-party content (TradingView charts) after your consent. Everything else on this site works without cookies from third parties.